 United States Infrared Satellite
The United States satellite images displayed are infrared (IR) images.
The United States satellite images displayed are infrared (IR) images. Warmest (lowest) clouds are shown in white; coldest (highest) clouds are displayed in shades of yellow, red, and purple. Imagery is obtained from the GOES and METEOSAT geostationary satellites, and the two US Polar Orbiter (POES) satellites. POES satellites orbit the earth 14 times each day at an altitude of approximately 520 miles (870 km). As each orbit is made the satellite can view a 1,600 mile (2,700 km) wide area of the earth. Due to the rotation of the earth the satellite is able to view every spot on earth twice each day. Data from multiple orbits are mosaicked together to provide wide scale global and full earth views in a single image. Occasional dark triangular areas that occur on POES images are a result of gaps in data transmitted from the orbiters. This is the map for US Satellite.
A weather satellite is a type of satellite that is primarily used to monitor the weather and climate of the Earth. These meteorological satellites, however, see more than clouds and cloud systems. City lights, fires, effects of pollution, auroras, sand and dust storms, snow cover, ice mapping, boundaries of ocean currents, energy flows, etc., are other types of environmental information collected using weather satellites.
Weather satellite images helped in monitoring the volcanic ash cloud from Mount St. Helens and activity from other volcanoes such as Mount Etna. Smoke from fires in the western United States such as Colorado and Utah have also been monitored.
Other environmental satellites can detect changes in the Earth's vegetation, sea state, ocean color, and ice fields. For example, the 2002 oil spill off the northwest coast of Spain was watched carefully by the European ENVISAT, which, though not a weather satellite, flies an instrument (ASAR) which can see changes in the sea surface.
El Niño and its effects on weather are monitored daily from satellite images. The Antarctic ozone hole is mapped from weather satellite data. Collectively, weather satellites flown by the U.S., Europe, India, China, Russia, and Japan provide nearly continuous observations for a global weather watch.
United States Infrared SatelliteThe United States satellite images displayed are infrared (IR) images.
 United States Visible Satellite
The visible satellite imagery is essentially a snapshot of what the satellite sees.
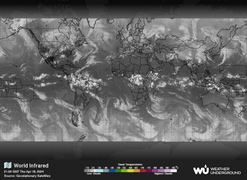 Global Infrared Satellite
The Global Infrared Satellite image shows clouds by their temperature.
 Global Visible Satellite
The visible satellite imagery is essentially a snapshot of what the satellite sees.


